Charting
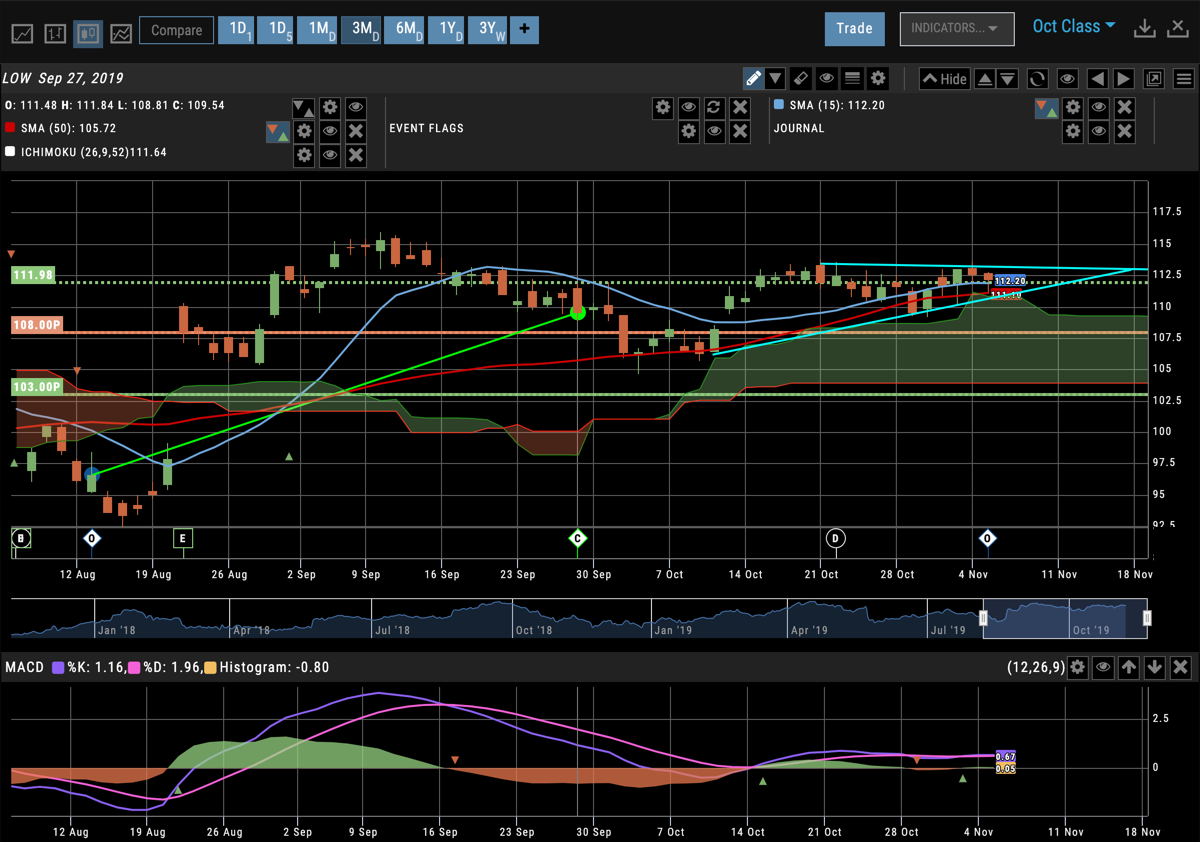
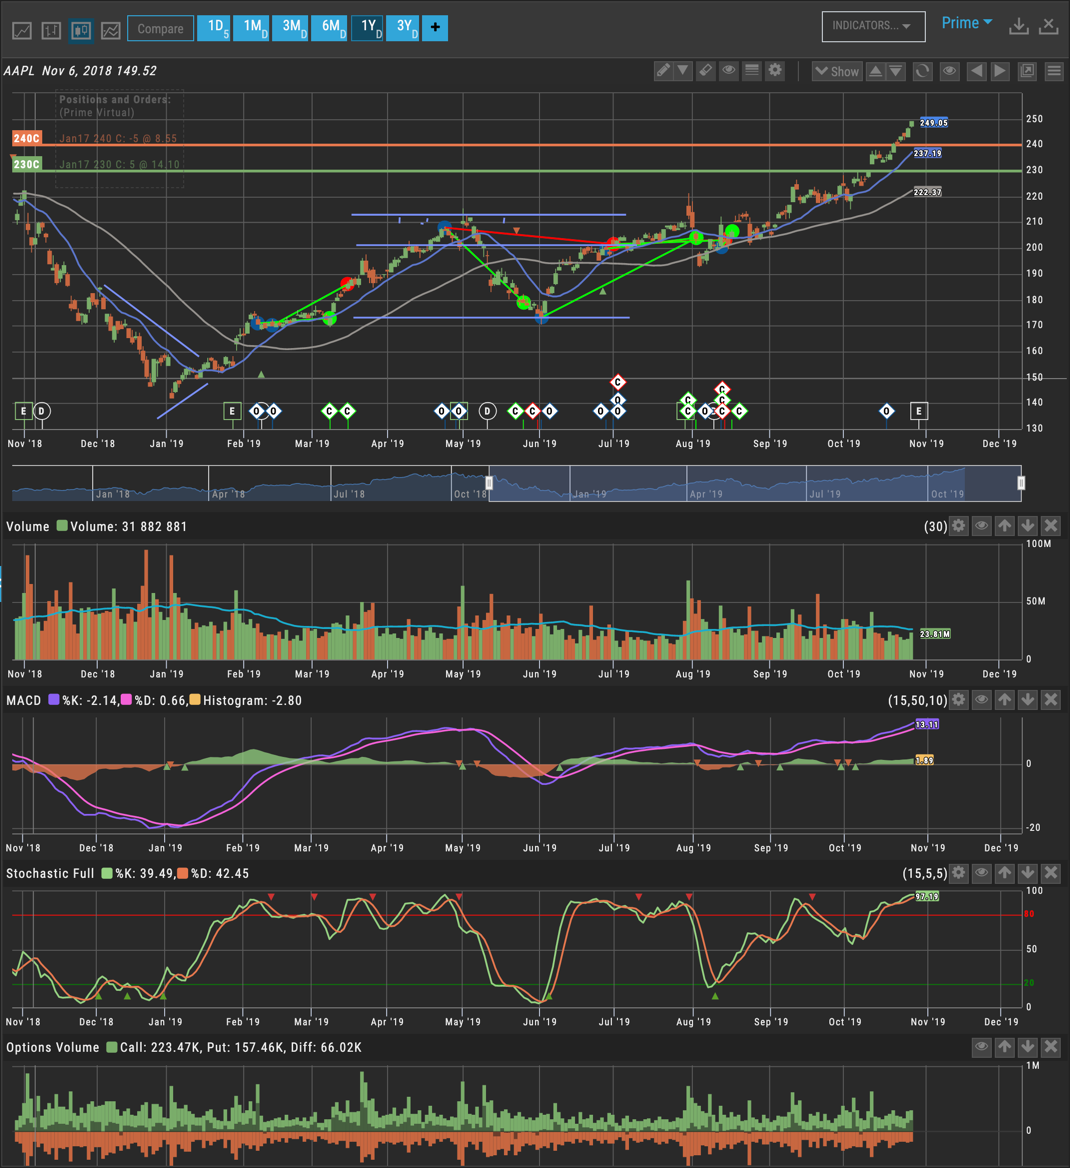
The iVest+ Charting module offers more than 100 indicators, all with customization available, for stock and options trading on multiple timeframes. The charts also show stock and options positions and allow you to adjust trades directly.


Everything Visual
Our charts show indicators and positions, but also prior trades, backtesting, and more when you need them to.
Indicators Your Way
We have hundreds of indicators so you can pick the tools you care about and then customize them to match your exact needs. The platform also teaches you what each indicator is based on. Unlike most platforms, many of our indicators are based on fundamental data and not just technical data.


Stack, Move, and Hide Indicators
You can add as many indicators on and below your charts as needed. Move them and hide them temporarily with the single click of a button.
Your Trades: Past, Present, and Futures
iVest+ offers one of the most complete charting packages in the industry, including showing active trades, prior trades, and options legs on the charts. Build the journal of your results into the charts. Every indicator is customizable. All trades, both current and past, can be displayed. Make the charts your best visual tool.
Your Broker.Your Choice.
Broker Integration
There is a good chance that you or your customers already have an account that connects to our product. We have integrated with the top names in the industry through various brokerage APIs. Getting started is simple, and if you don’t already have an account with one of these brokerages, you can typically open one in a day.


